C.elegans
Comparison with deep learning RNA velocity framework (DeepVelo: https://github.com/bowang-lab/DeepVelo, UniTVelo: https://github.com/StatBiomed/UniTVelo and VeloVAE: https://github.com/welch-lab/VeloVAE)
[76]:
import anndata
import numpy as np
import scvelo as scv
import scanpy as sc
import torch
import os.path
import pandas as pd
from Bio import Phylo
import matplotlib.pyplot as plt
[20]:
import matplotlib.pyplot as plt
[3]:
adata = scv.read("/data/liangzhen/wangk_Celegans/RNA_velocity_paper_force_cell/all.loom",cache=True)

adata_cells = adata.obs.index.to_list()
adata_cells = [cell.split(':')[1].replace("x","-b01") if 'Murray_b01' in cell else cell for cell in adata_cells ]
adata_cells = [cell.split(':')[1].replace("x","-b02") if 'Murray_b02' in cell else cell for cell in adata_cells ]
adata_cells = [cell.split(':')[1].replace("x","-r17") if 'Murray_r17' in cell else cell for cell in adata_cells ]
adata_cells = [cell.split(':')[1].replace("x","-300.1.1") if 'Waterston_300_min_10X_lane_1' in cell else cell for cell in adata_cells ]
adata_cells = [cell.split(':')[1].replace("x","-300.1.2") if 'Waterston_300_min_10X_lane_2' in cell else cell for cell in adata_cells ]
adata_cells = [cell.split(':')[1].replace("x","-300.1.3") if 'Waterston_300_min_10X_lane_3' in cell else cell for cell in adata_cells ]
adata_cells = [cell.split(':')[1].replace("x","-400.2.1") if 'Waterston_400_min_10X_lane_1' in cell else cell for cell in adata_cells ]
adata_cells = [cell.split(':')[1].replace("x","-400.2.2") if 'Waterston_400_min_10X_lane_2' in cell else cell for cell in adata_cells ]
adata_cells = [cell.split(':')[1].replace("x","-400.2.3") if 'Waterston_400_min_10X_lane_3' in cell else cell for cell in adata_cells ]
adata_cells = [cell.split(':')[1].replace("x","-500.1.1") if 'Waterston_500_min_batch_1_10X_lane_1' in cell else cell for cell in adata_cells ]
adata_cells = [cell.split(':')[1].replace("x","-500.1.2") if 'Waterston_500_min_batch_1_10X_lane_2' in cell else cell for cell in adata_cells ]
adata_cells = [cell.split(':')[1].replace("x","-500.1.3") if 'Waterston_500_min_batch_1_10X_lane_3' in cell else cell for cell in adata_cells ]
adata_cells = [cell.split(':')[1].replace("x","-500.2.1") if 'Waterston_500_min_batch_2_10X_lane_1' in cell else cell for cell in adata_cells ]
adata_cells = [cell.split(':')[1].replace("x","-500.2.2") if 'Waterston_500_min_batch_2_10X_lane_2' in cell else cell for cell in adata_cells ]


wk_data = pd.read_csv("/data/liangzhen/wangk_Celegans/c_eles_sample.csv",sep=',',header=0,index_col=0)
wk_cells = wk_data.index.to_list()

select_cell = adata.obs.index[[adata_cells.index(cell) for cell in wk_cells if cell in adata_cells]].to_list()

adata_select = adata[select_cell,]
scv.pp.filter_and_normalize(adata_select,min_shared_counts=20, n_top_genes=2000)
scv.pp.moments(adata_select,n_pcs=30, n_neighbors=30)  #calculate the first and second order moments
# scv.tl.tsne(adata_select)
# scv.tl.umap(adata_select)

import pyreadr
globalumap = pyreadr.read_r('/data/liangzhen/wangk_Celegans/globalumap2d_Qin.rds')
globalumap = globalumap[None]
wk_umap = globalumap.loc[wk_data.index]
adata_select.obsm['X_umap'] = wk_umap.to_numpy()

GT_data = pd.read_csv("/data/liangzhen/wangk_Celegans/RNA_velocity_paper_force_cell/cell_anno_generation_time.csv",sep=',',header=0,index_col=0)
adata_select.obs["embryo_time"] = [float(time) for time in GT_data.loc[wk_data.index]["embryo.time"].to_list()]
adata_select.obs["generation_time"] = [float(time) for time in GT_data.loc[wk_data.index]["generation_time"].to_list()]
Trying to set attribute `.obs` of view, copying.
Filtered out 19955 genes that are detected 20 counts (shared).
Normalized count data: X, spliced, unspliced.
Skip filtering by dispersion since number of variables are less than `n_top_genes`.
Logarithmized X.
computing neighbors
2022-10-30 09:59:45.214098: I tensorflow/core/platform/cpu_feature_guard.cc:193] This TensorFlow binary is optimized with oneAPI Deep Neural Network Library (oneDNN) to use the following CPU instructions in performance-critical operations:  AVX2 AVX512F AVX512_VNNI FMA
To enable them in other operations, rebuild TensorFlow with the appropriate compiler flags.
2022-10-30 09:59:47.263686: I tensorflow/core/util/util.cc:169] oneDNN custom operations are on. You may see slightly different numerical results due to floating-point round-off errors from different computation orders. To turn them off, set the environment variable `TF_ENABLE_ONEDNN_OPTS=0`.
2022-10-30 09:59:48.354903: W tensorflow/stream_executor/platform/default/dso_loader.cc:64] Could not load dynamic library 'libcudart.so.11.0'; dlerror: libcudart.so.11.0: cannot open shared object file: No such file or directory; LD_LIBRARY_PATH: /usr/local/torque/lib
2022-10-30 09:59:48.354931: I tensorflow/stream_executor/cuda/cudart_stub.cc:29] Ignore above cudart dlerror if you do not have a GPU set up on your machine.
2022-10-30 09:59:48.455147: E tensorflow/stream_executor/cuda/cuda_blas.cc:2981] Unable to register cuBLAS factory: Attempting to register factory for plugin cuBLAS when one has already been registered
2022-10-30 09:59:50.700695: W tensorflow/stream_executor/platform/default/dso_loader.cc:64] Could not load dynamic library 'libnvinfer.so.7'; dlerror: libnvinfer.so.7: cannot open shared object file: No such file or directory; LD_LIBRARY_PATH: /usr/local/torque/lib
2022-10-30 09:59:50.701025: W tensorflow/stream_executor/platform/default/dso_loader.cc:64] Could not load dynamic library 'libnvinfer_plugin.so.7'; dlerror: libnvinfer_plugin.so.7: cannot open shared object file: No such file or directory; LD_LIBRARY_PATH: /usr/local/torque/lib
2022-10-30 09:59:50.701037: W tensorflow/compiler/tf2tensorrt/utils/py_utils.cc:38] TF-TRT Warning: Cannot dlopen some TensorRT libraries. If you would like to use Nvidia GPU with TensorRT, please make sure the missing libraries mentioned above are installed properly.
    finished (0:00:13) --> added
    'distances' and 'connectivities', weighted adjacency matrices (adata.obsp)
computing moments based on connectivities
    finished (0:00:00) --> added
    'Ms' and 'Mu', moments of un/spliced abundances (adata.layers)
scVelo - dynamical
[77]:
adata_scv = adata_select.copy()

scv.tl.recover_dynamics(adata_scv)
scv.tl.velocity(adata_scv,mode="dynamical")
scv.tl.velocity_graph(adata_scv)
scv.tl.velocity_pseudotime(adata_scv)
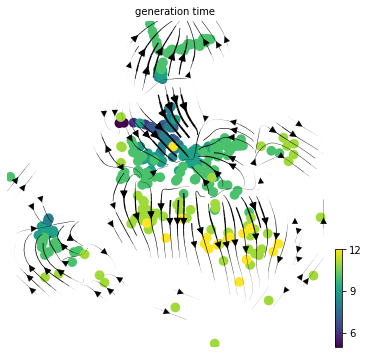
scv.pl.velocity_embedding_stream(adata_scv, basis='X_umap',color="generation_time",figsize=[6,6],s=380,alpha=1,density=1.5,arrow_size=1.5,legend_loc='None',
                               smooth=1)
recovering dynamics (using 1/64 cores)
    finished (0:00:12) --> added
    'fit_pars', fitted parameters for splicing dynamics (adata.var)
computing velocities
    finished (0:00:00) --> added
    'velocity', velocity vectors for each individual cell (adata.layers)
computing velocity graph (using 1/64 cores)
    finished (0:00:00) --> added
    'velocity_graph', sparse matrix with cosine correlations (adata.uns)
computing terminal states
    identified 1 region of root cells and 1 region of end points .
    finished (0:00:00) --> added
    'root_cells', root cells of Markov diffusion process (adata.obs)
    'end_points', end points of Markov diffusion process (adata.obs)
computing velocity embedding
    finished (0:00:00) --> added
    'velocity_umap', embedded velocity vectors (adata.obsm)
[78]:
scv.tl.latent_time(adata_scv)
computing latent time using root_cells as prior
    finished (0:00:00) --> added
    'latent_time', shared time (adata.obs)
[79]:
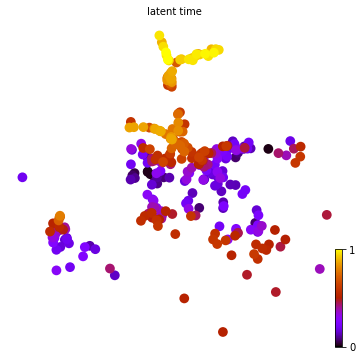
scv.pl.scatter(adata_scv, color='latent_time', color_map='gnuplot',figsize=[6,6],s=380,alpha=1,legend_loc='None')
[ ]:
[ ]:
deepvelo
[84]:
from deepvelo.utils import velocity, velocity_confidence, update_dict
from deepvelo.utils.preprocess import autoset_coeff_s
from deepvelo.utils.plot import statplot, compare_plot
from deepvelo import train, Constants
from deepvelo.utils.temporal import latent_time
[85]:
adata_dv = adata_select.copy()
[86]:
# specific configs to overide the default configs
configs = {
    "name": "DeepVelo", # name of the experiment
    "loss": {"args": {"coeff_s": autoset_coeff_s(adata_dv)}},
    "trainer": {"verbosity": 0}, # increase verbosity to show training progress
}
configs = update_dict(Constants.default_configs, configs)
configs['n_gpu']=0
The ratio of spliced reads is 95.3% (more than 85%). Suggest using coeff_s 1.0.
[87]:
velocity(adata_dv, mask_zero=False)
trainer = train(adata_dv, configs)
computing velocities
INFO:train:Beginning training of DeepVelo ...
    finished (0:00:00) --> added
    'velocity', velocity vectors for each individual cell (adata.layers)
Warning: logging configuration file is not found in logger/logger_config.json.
building graph
velo data shape: torch.Size([300, 267])
velo_mat shape: (300, 267)
--> added 'velocity' (adata.layers)
--> added 'velocity_unspliced' (adata.layers)
--> added 'cell_specific_beta' (adata.layers)
--> added 'cell_specific_gamma' (adata.layers)
[88]:
scv.tl.velocity_graph(adata_dv, n_jobs=8)
computing velocity graph (using 8/64 cores)
    finished (0:00:12) --> added
    'velocity_graph', sparse matrix with cosine correlations (adata.uns)
[89]:
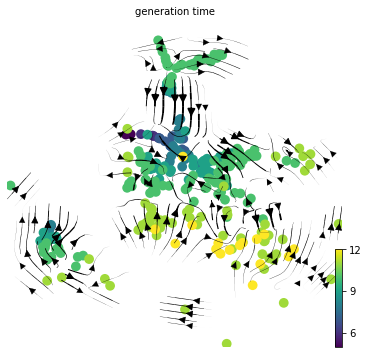
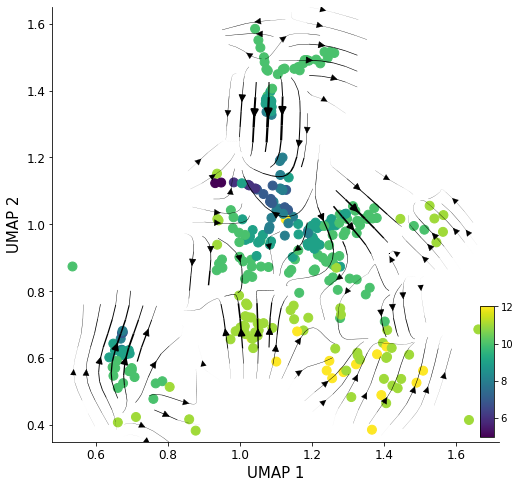
scv.pl.velocity_embedding_stream(adata_dv, basis='X_umap',color="generation_time",figsize=[6,6],s=380,alpha=1,density=1.5,arrow_size=1.5,legend_loc='None',
                               smooth=1)
computing velocity embedding
    finished (0:00:00) --> added
    'velocity_umap', embedded velocity vectors (adata.obsm)
[90]:
latent_time(adata_dv)
computing terminal states
    identified 1 region of root cells and 1 region of end points .
    finished (0:00:00) --> added
    'root_cells', root cells of Markov diffusion process (adata.obs)
    'end_points', end points of Markov diffusion process (adata.obs)
computing latent time using root_cells as prior
    finished (0:00:00) --> added
    'latent_time', shared time (adata.obs)
[91]:
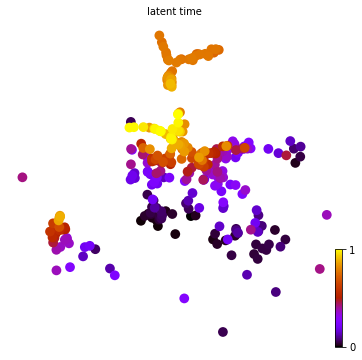
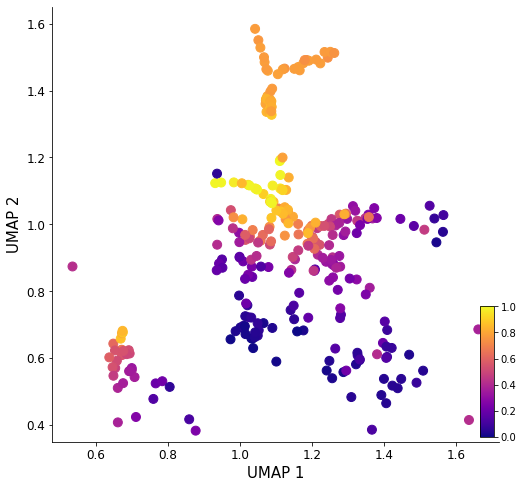
scv.pl.scatter(adata_dv, color='latent_time', color_map='gnuplot',figsize=[6,6],s=380,alpha=1,legend_loc='None')
[ ]:
UnitVelo
[92]:
import unitvelo as utv
(Running UniTVelo 0.2.4.3)
2022-10-30 08:29:12
[93]:
adata_utv = adata_select.copy()
[94]:
velo_config = utv.config.Configuration()
velo_config.R2_ADJUST = True
velo_config.IROOT = None
velo_config.FIT_OPTION = '1'
velo_config.AGENES_R2 = 1
[95]:
adata = utv.run_model(adata_utv, 'generation_time', config_file=velo_config)
-------> Manully Specified Parameter <-------
None


-------> Model Configuration Settings <------
N_TOP_GENES:    2000
LEARNING_RATE:  0.01
FIT_OPTION:     1
DENSITY:        SVD
REORDER_CELL:   Soft_Reorder
AGGREGATE_T:    True
R2_ADJUST:      True
GENE_PRIOR:     None
VGENES: basic
IROOT:  None


Current working dir is /home/wangkun
Results will be stored in res folder
2022-10-30 16:29:13.042901: W tensorflow/stream_executor/platform/default/dso_loader.cc:64] Could not load dynamic library 'libcuda.so.1'; dlerror: libcuda.so.1: cannot open shared object file: No such file or directory; LD_LIBRARY_PATH: /usr/local/torque/lib
2022-10-30 16:29:13.042936: W tensorflow/stream_executor/cuda/cuda_driver.cc:263] failed call to cuInit: UNKNOWN ERROR (303)
2022-10-30 16:29:13.042959: I tensorflow/stream_executor/cuda/cuda_diagnostics.cc:156] kernel driver does not appear to be running on this host (node2): /proc/driver/nvidia/version does not exist
2022-10-30 16:29:13.043552: I tensorflow/core/platform/cpu_feature_guard.cc:193] This TensorFlow binary is optimized with oneAPI Deep Neural Network Library (oneDNN) to use the following CPU instructions in performance-critical operations:  AVX2 AVX512F AVX512_VNNI FMA
To enable them in other operations, rebuild TensorFlow with the appropriate compiler flags.
---> # of velocity genes used 85
---> # of velocity genes used 84
---> # of velocity genes used 84
22,269: 100%|████████████████████████████▉| 11997/12000 [04:05<00:00, 40.49it/s]
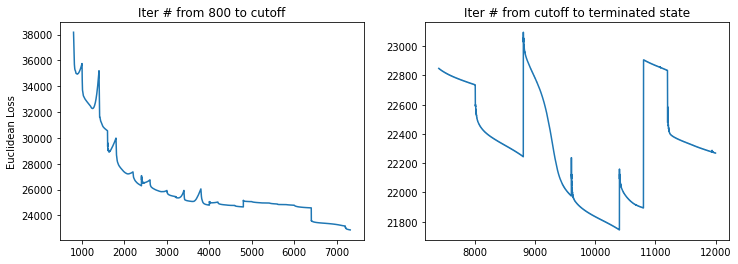
22,269: 100%|████████████████████████████▉| 11999/12000 [04:06<00:00, 48.68it/s]
Total loss 21744, vgene loss 22269
[96]:
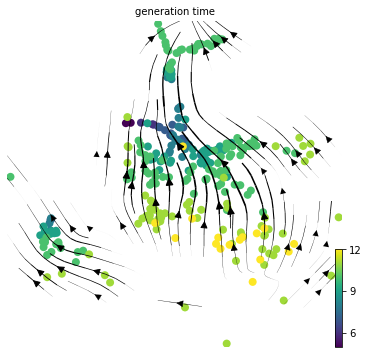
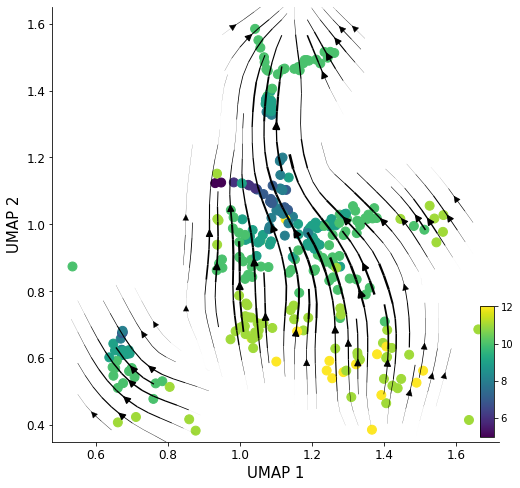
scv.pl.velocity_embedding_stream(adata_utv, color='generation_time', basis='X_umap',figsize=[6,6],s=255,alpha=1,density=1,arrow_size=1.5,smooth=1)
[97]:
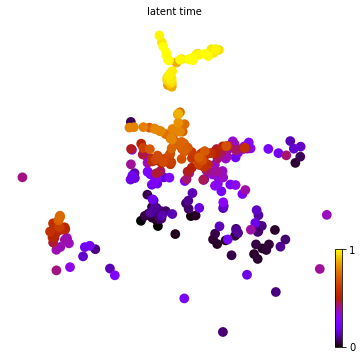
scv.tl.latent_time(adata_utv,min_likelihood=None)
scv.pl.scatter(adata_utv, color='latent_time', color_map='gnuplot',figsize=[6,6],s=380,alpha=1,legend_loc='None')
[ ]:
VeloVAE
[4]:
import sys
sys.path.append('/home/wangkun/VeloVAE-master/')
import velovae as vv
[65]:
adata_vv = adata_select.copy()
[67]:
scv.tl.recover_dynamics(adata_vv)
scv.tl.velocity(adata_vv,mode="dynamical")
scv.tl.velocity_graph(adata_vv)
scv.tl.velocity_pseudotime(adata_vv)
scv.tl.latent_time(adata_vv)
recovering dynamics (using 1/64 cores)
    finished (0:00:11) --> added
    'fit_pars', fitted parameters for splicing dynamics (adata.var)
computing velocities
    finished (0:00:00) --> added
    'velocity', velocity vectors for each individual cell (adata.layers)
computing velocity graph (using 1/64 cores)
    finished (0:00:00) --> added
    'velocity_graph', sparse matrix with cosine correlations (adata.uns)
computing terminal states
    identified 1 region of root cells and 1 region of end points .
    finished (0:00:00) --> added
    'root_cells', root cells of Markov diffusion process (adata.obs)
    'end_points', end points of Markov diffusion process (adata.obs)
computing latent time using root_cells as prior
    finished (0:00:00) --> added
    'latent_time', shared time (adata.obs)
[68]:
torch.manual_seed(2022)
np.random.seed(2022)
full_vb = vv.VAEFullVB(adata_vv, tmax=20, dim_z=5)
Initialization using the steady-state and dynamical models.
Gaussian Prior.
[69]:
full_vb.train(adata_vv, plot=True, config={'batch_size':32, 'n_neighbors':5}, figure_path='/home/wangkun/fullvb/celegans', embed="umap")
--------------------------- Train a VeloVAE ---------------------------
*********        Creating Training/Validation Datasets        *********
*********                      Finished.                      *********
*********                 Creating optimizers                 *********
*********                      Finished.                      *********
*********                    Start training                   *********
*********                      Stage  1                       *********
Total Number of Iterations Per Epoch: 7, test iteration: 12
Epoch 1: Train ELBO = -79137.258, Test ELBO = -326873.281,       Total Time =   0 h :  0 m :  0 s
Epoch 100: Train ELBO = -1681.788, Test ELBO = -1931.602,        Total Time =   0 h :  0 m : 11 s
Epoch 200: Train ELBO = -766.894, Test ELBO = -1054.477,         Total Time =   0 h :  0 m : 21 s
Epoch 300: Train ELBO = -588.448, Test ELBO = -766.455,          Total Time =   0 h :  0 m : 32 s
Epoch 400: Train ELBO = -416.151, Test ELBO = -536.519,          Total Time =   0 h :  0 m : 43 s
Epoch 500: Train ELBO = -299.005, Test ELBO = -417.750,          Total Time =   0 h :  0 m : 53 s
Epoch 600: Train ELBO = -236.217, Test ELBO = -355.072,          Total Time =   0 h :  1 m :  4 s
Epoch 700: Train ELBO = -218.516, Test ELBO = -327.293,          Total Time =   0 h :  1 m : 15 s
*********       Stage 1: Early Stop Triggered at epoch 746.       *********
*********                      Stage  2                       *********
Cell-wise KNN Estimation.
Percentage of Invalid Sets: 0.207
Average Set Size: 10
Finished. Actual Time:   0 h :  0 m :  0 s
Epoch 747: Train ELBO = -3088.242, Test ELBO = -3403.359,        Total Time =   0 h :  1 m : 20 s
Epoch 800: Train ELBO = -166.382, Test ELBO = -249.401,          Total Time =   0 h :  1 m : 26 s
Epoch 900: Train ELBO = -62.672, Test ELBO = -135.594,   Total Time =   0 h :  1 m : 36 s
Epoch 1000: Train ELBO = -50.788, Test ELBO = -115.298,          Total Time =   0 h :  1 m : 46 s
Epoch 1100: Train ELBO = -43.913, Test ELBO = -106.181,          Total Time =   0 h :  1 m : 56 s
Epoch 1200: Train ELBO = -35.541, Test ELBO = -93.009,   Total Time =   0 h :  2 m :  5 s
*********       Stage 2: Early Stop Triggered at epoch 1273.       *********
*********              Finished. Total Time =   0 h :  2 m : 13 s             *********
[70]:
full_vb.save_anndata(adata_vv, 'fullvb',file_path='/home/wangkun/VeloVAE-master/', file_name="celegans_out.h5ad")
[71]:
key = 'fullvb'
scv.tl.velocity_graph(adata_vv, vkey=f'{key}_velocity')
scv.tl.velocity_embedding(adata_vv, vkey=f'{key}_velocity')
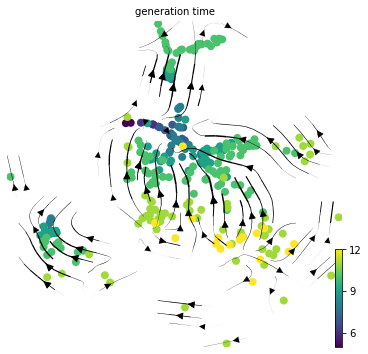
scv.pl.velocity_embedding_stream(adata_vv, vkey=f'{key}_velocity', color='generation_time', basis='X_umap',figsize=[6,6],s=255,alpha=1,density=1,arrow_size=1.5,smooth=1)
computing velocity graph (using 1/64 cores)
    finished (0:00:00) --> added
    'fullvb_velocity_graph', sparse matrix with cosine correlations (adata.uns)
computing velocity embedding
    finished (0:00:00) --> added
    'fullvb_velocity_umap', embedded velocity vectors (adata.obsm)
[72]:
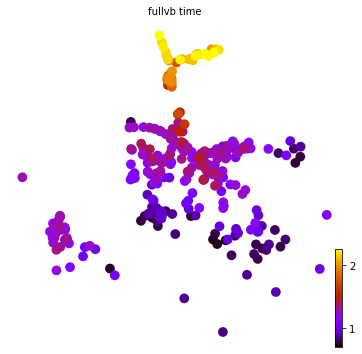
scv.pl.scatter(adata_vv, color='fullvb_time', color_map='gnuplot',figsize=[6,6],s=380,alpha=1,legend_loc='None')
[ ]:
[74]:
import phylovelo as pv
import matplotlib.pyplot as plt
from mpl_toolkits.axes_grid1.inset_locator import inset_axes

def norm_time(x):
    x -= min(x)
    return x/max(x)
[80]:
name = 'celegans_scvelo'
fig, ax = plt.subplots()
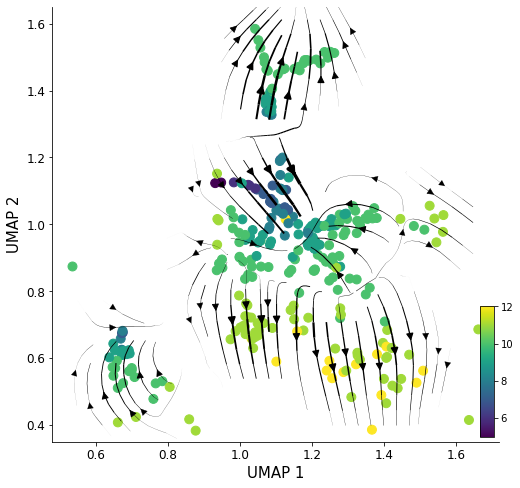
scatter = ax.scatter(adata.obsm['X_umap'][:, 0], adata.obsm['X_umap'][:, 1], c=adata.obs['generation_time'], s=80)
ax = pv.ana_utils.velocity_plot(adata.obsm['X_umap'], adata_scv.obsm['velocity_umap'], ax, 'stream',streamdensity=1.2, grid_density=25, radius=0.12, lw_coef=1500, arrowsize=1.5)
ax.figure.set_size_inches(8,8)
ax.set_xlabel('UMAP 1', fontsize=15)
ax.set_ylabel('UMAP 2', fontsize=15)
plt.yticks(fontsize=12)
plt.xticks(fontsize=12)
cbaxes = inset_axes(ax, width="3%", height="30%", loc='lower right')
plt.colorbar(scatter, cax=cbaxes, orientation='vertical')
ax.spines['right'].set_visible(False)
ax.spines['top'].set_visible(False)
ax.set_ylim(0.35,1.65)
plt.savefig('/home/wangkun/modelcomp_figs/'+name+'.png', format='png')

fig, ax = plt.subplots()
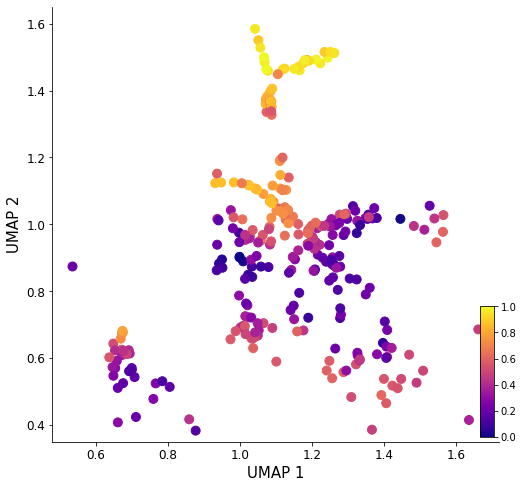
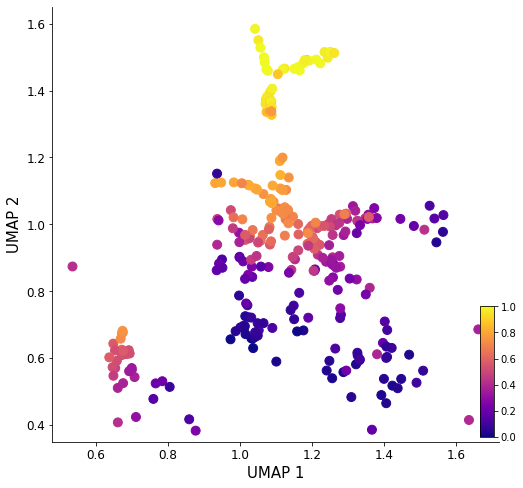
scatter = ax.scatter(adata.obsm['X_umap'][:, 0], adata.obsm['X_umap'][:, 1], c=adata_scv.obs['latent_time'], cmap='plasma', s=80)
ax.figure.set_size_inches(8,8)
ax.set_xlabel('UMAP 1', fontsize=15)
ax.set_ylabel('UMAP 2', fontsize=15)
plt.yticks(fontsize=12)
plt.xticks(fontsize=12)
cbaxes = inset_axes(ax, width="3%", height="30%", loc='lower right')
plt.colorbar(scatter, cax=cbaxes, orientation='vertical')
ax.spines['right'].set_visible(False)
ax.spines['top'].set_visible(False)
ax.set_ylim(0.35,1.65)

plt.savefig('/home/wangkun/modelcomp_figs/'+name+'_lt.png', format='png')


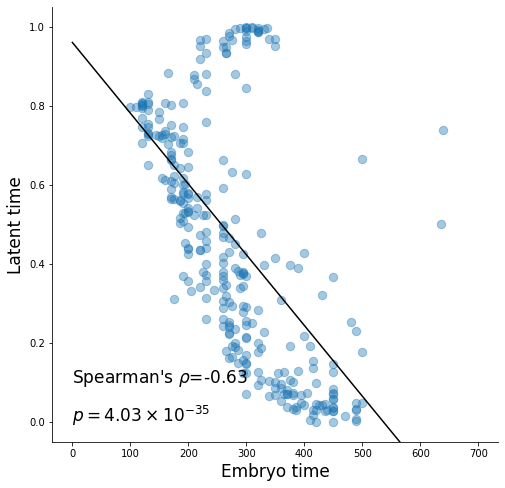
from scipy.stats import spearmanr
x = adata.obs['embryo_time']
y = adata_scv.obs['latent_time']

a, b = np.polyfit(x, y, deg=1)
y_est = a * np.linspace(0,700,100) + b

fig, ax = plt.subplots(figsize=(8, 8))
ax.scatter(x, y, alpha=0.4, s=70)
ax.plot(np.linspace(0,700,100), y_est, '-', c='k')
ax.set_xlabel('Embryo time', fontsize=17)
ax.set_ylabel('Latent time', fontsize=17)
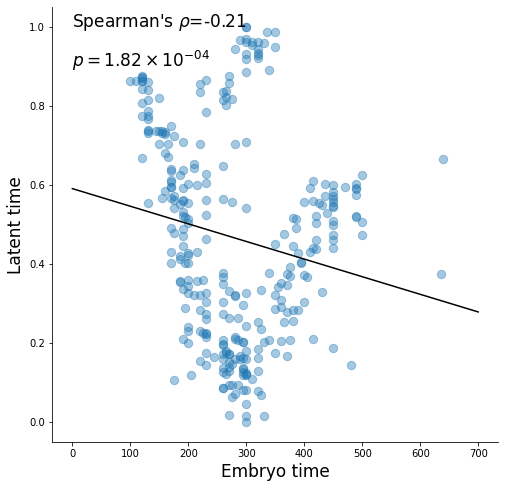
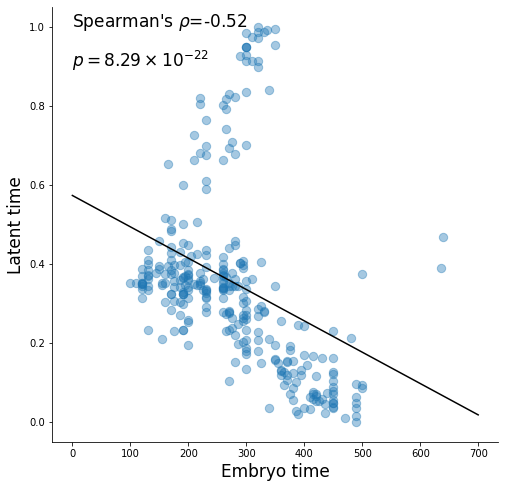
rho, pval = spearmanr(x, y)
ax.text(0, 1, r"Spearman's $\rho$={:.2g}".format(rho), fontsize=17)
ax.text(0, 0.9, r'$p={}\times 10^{}$'.format(*r'{:.2e}'.format(pval).split('e')).replace('^', '^{').replace('$', '}$')[1:], fontsize=17)
# ax.text(0, 0.9, r'$p={:.2e}$'.format(pval), fontsize=17)

ax.spines['right'].set_visible(False)
ax.spines['top'].set_visible(False)

plt.savefig('/home/wangkun/modelcomp_figs/'+name+'_cmp.png', format='png')
[98]:
name = 'celegans_deepvelo'
fig, ax = plt.subplots()
scatter = ax.scatter(adata.obsm['X_umap'][:, 0], adata.obsm['X_umap'][:, 1], c=adata.obs['generation_time'], s=80)
ax = pv.ana_utils.velocity_plot(adata.obsm['X_umap'], adata_dv.obsm['velocity_umap'], ax, 'stream',streamdensity=1.2, grid_density=25, radius=0.12, lw_coef=1500, arrowsize=1.5)
ax.figure.set_size_inches(8,8)
ax.set_xlabel('UMAP 1', fontsize=15)
ax.set_ylabel('UMAP 2', fontsize=15)
plt.yticks(fontsize=12)
plt.xticks(fontsize=12)
cbaxes = inset_axes(ax, width="3%", height="30%", loc='lower right')
plt.colorbar(scatter, cax=cbaxes, orientation='vertical')
ax.spines['right'].set_visible(False)
ax.spines['top'].set_visible(False)
ax.set_ylim(0.35,1.65)
plt.savefig('/home/wangkun/modelcomp_figs/'+name+'.png', format='png')

fig, ax = plt.subplots()
scatter = ax.scatter(adata.obsm['X_umap'][:, 0], adata.obsm['X_umap'][:, 1], c=adata_dv.obs['latent_time'], cmap='plasma', s=80)
ax.figure.set_size_inches(8,8)
ax.set_xlabel('UMAP 1', fontsize=15)
ax.set_ylabel('UMAP 2', fontsize=15)
plt.yticks(fontsize=12)
plt.xticks(fontsize=12)
cbaxes = inset_axes(ax, width="3%", height="30%", loc='lower right')
plt.colorbar(scatter, cax=cbaxes, orientation='vertical')
ax.spines['right'].set_visible(False)
ax.spines['top'].set_visible(False)
ax.set_ylim(0.35,1.65)

plt.savefig('/home/wangkun/modelcomp_figs/'+name+'_lt.png', format='png')

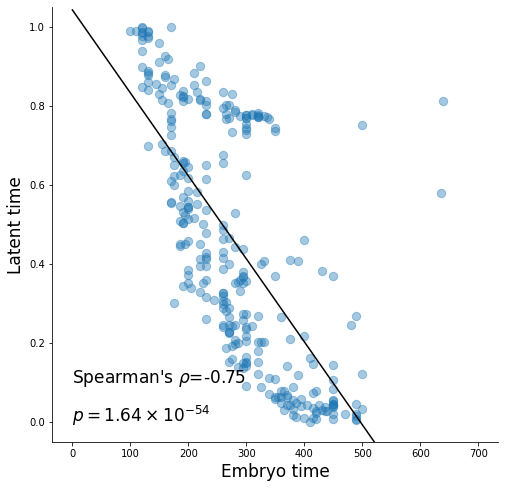
from scipy.stats import spearmanr
x = adata.obs['embryo_time']
y = adata_dv.obs['latent_time']

a, b = np.polyfit(x, y, deg=1)
y_est = a * np.linspace(0,700,100) + b

fig, ax = plt.subplots(figsize=(8, 8))
ax.scatter(x, y, alpha=0.4, s=70)
ax.plot(np.linspace(0,700,100), y_est, '-', c='k')
ax.set_xlabel('Embryo time', fontsize=17)
ax.set_ylabel('Latent time', fontsize=17)
rho, pval = spearmanr(x, y)
ax.text(0, 0.1, r"Spearman's $\rho$={:.2g}".format(rho), fontsize=17)
ax.text(0, 0.0, r'$p={}\times 10^{}$'.format(*r'{:.2e}'.format(pval).split('e')).replace('^', '^{').replace('$', '}$')[1:], fontsize=17)
# ax.text(0, 0.9, r'$p={:.2e}$'.format(pval), fontsize=17)
ax.set_ylim(-0.05, 1.05)
ax.spines['right'].set_visible(False)
ax.spines['top'].set_visible(False)
plt.savefig('/home/wangkun/modelcomp_figs/'+name+'_cmp.png', format='png')
[ ]:
[99]:
name = 'celegans_unitvelo'
fig, ax = plt.subplots()
scatter = ax.scatter(adata.obsm['X_umap'][:, 0], adata.obsm['X_umap'][:, 1], c=adata.obs['generation_time'], s=80)
ax = pv.ana_utils.velocity_plot(adata.obsm['X_umap'], adata_utv.obsm['velocity_umap'], ax, 'stream',streamdensity=1.2, grid_density=25, radius=0.12, lw_coef=1500, arrowsize=1.5)
ax.figure.set_size_inches(8,8)
ax.set_xlabel('UMAP 1', fontsize=15)
ax.set_ylabel('UMAP 2', fontsize=15)
plt.yticks(fontsize=12)
plt.xticks(fontsize=12)
cbaxes = inset_axes(ax, width="3%", height="30%", loc='lower right')
plt.colorbar(scatter, cax=cbaxes, orientation='vertical')
ax.spines['right'].set_visible(False)
ax.spines['top'].set_visible(False)
ax.set_ylim(0.35,1.65)
plt.savefig('/home/wangkun/modelcomp_figs/'+name+'.png', format='png')

fig, ax = plt.subplots()
scatter = ax.scatter(adata.obsm['X_umap'][:, 0], adata.obsm['X_umap'][:, 1], c=adata_utv.obs['latent_time'], cmap='plasma', s=80)
ax.figure.set_size_inches(8,8)
ax.set_xlabel('UMAP 1', fontsize=15)
ax.set_ylabel('UMAP 2', fontsize=15)
plt.yticks(fontsize=12)
plt.xticks(fontsize=12)
cbaxes = inset_axes(ax, width="3%", height="30%", loc='lower right')
plt.colorbar(scatter, cax=cbaxes, orientation='vertical')
ax.spines['right'].set_visible(False)
ax.spines['top'].set_visible(False)
ax.set_ylim(0.35,1.65)

plt.savefig('/home/wangkun/modelcomp_figs/'+name+'_lt.png', format='png')


from scipy.stats import spearmanr
x = adata.obs['embryo_time']
y = adata_utv.obs['latent_time']

a, b = np.polyfit(x, y, deg=1)
y_est = a * np.linspace(0,700,100) + b

fig, ax = plt.subplots(figsize=(8, 8))
ax.scatter(x, y, alpha=0.4, s=70)
ax.plot(np.linspace(0,700,100), y_est, '-', c='k')
ax.set_xlabel('Embryo time', fontsize=17)
ax.set_ylabel('Latent time', fontsize=17)
rho, pval = spearmanr(x, y)
ax.text(0, 0.1, r"Spearman's $\rho$={:.2g}".format(rho), fontsize=17)
ax.text(0, 0.0, r'$p={}\times 10^{}$'.format(*r'{:.2e}'.format(pval).split('e')).replace('^', '^{').replace('$', '}$')[1:], fontsize=17)
# ax.text(0, 0.9, r'$p={:.2e}$'.format(pval), fontsize=17)
ax.set_ylim(-0.05, 1.05)
ax.spines['right'].set_visible(False)
ax.spines['top'].set_visible(False)
plt.savefig('/home/wangkun/modelcomp_figs/'+name+'_cmp.png', format='png')
[83]:
name = 'celegans_velovae'
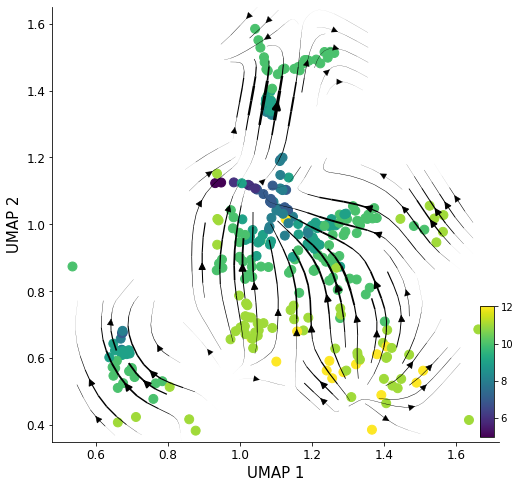
fig, ax = plt.subplots()
scatter = ax.scatter(adata.obsm['X_umap'][:, 0], adata.obsm['X_umap'][:, 1], c=adata.obs['generation_time'], s=80)
ax = pv.ana_utils.velocity_plot(adata.obsm['X_umap'], adata_vv.obsm['fullvb_velocity_umap'], ax, 'stream',streamdensity=1.2, grid_density=25, radius=0.12, lw_coef=1500, arrowsize=1.5)
ax.figure.set_size_inches(8,8)
ax.set_xlabel('UMAP 1', fontsize=15)
ax.set_ylabel('UMAP 2', fontsize=15)
plt.yticks(fontsize=12)
plt.xticks(fontsize=12)
cbaxes = inset_axes(ax, width="3%", height="30%", loc='lower right')
plt.colorbar(scatter, cax=cbaxes, orientation='vertical')
ax.spines['right'].set_visible(False)
ax.spines['top'].set_visible(False)
ax.set_ylim(0.35,1.65)
plt.savefig('/home/wangkun/modelcomp_figs/'+name+'.png', format='png')

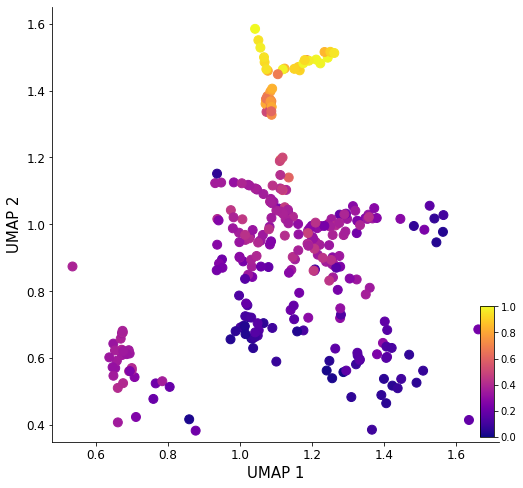
fig, ax = plt.subplots()
scatter = ax.scatter(adata.obsm['X_umap'][:, 0], adata_vv.obsm['X_umap'][:, 1], c=norm_time(adata_vv.obs['fullvb_time']), cmap='plasma', s=80)
ax.figure.set_size_inches(8,8)
ax.set_xlabel('UMAP 1', fontsize=15)
ax.set_ylabel('UMAP 2', fontsize=15)
plt.yticks(fontsize=12)
plt.xticks(fontsize=12)
cbaxes = inset_axes(ax, width="3%", height="30%", loc='lower right')
plt.colorbar(scatter, cax=cbaxes, orientation='vertical')
ax.spines['right'].set_visible(False)
ax.spines['top'].set_visible(False)
ax.set_ylim(0.35,1.65)

plt.savefig('/home/wangkun/modelcomp_figs/'+name+'_lt.png', format='png')


from scipy.stats import spearmanr
x = adata.obs['embryo_time']
y = norm_time(adata_vv.obs['fullvb_time'])

a, b = np.polyfit(x, y, deg=1)
y_est = a * np.linspace(0,700,100) + b

fig, ax = plt.subplots(figsize=(8, 8))
ax.scatter(x, y, alpha=0.4, s=70)
ax.plot(np.linspace(0,700,100), y_est, '-', c='k')
ax.set_xlabel('Embryo time', fontsize=17)
ax.set_ylabel('Latent time', fontsize=17)
rho, pval = spearmanr(x, y)
ax.text(0, 1, r"Spearman's $\rho$={:.2g}".format(rho), fontsize=17)
ax.text(0, 0.9, r'$p={}\times 10^{}$'.format(*r'{:.2e}'.format(pval).split('e')).replace('^', '^{').replace('$', '}$')[1:], fontsize=17)
ax.spines['right'].set_visible(False)
ax.spines['top'].set_visible(False)
plt.savefig('/home/wangkun/modelcomp_figs/'+name+'_cmp.png', format='png')
Cell Dancer
[ ]:
import celldancer.utilities as cdutil
cdutil.adata_to_df_with_embed(adata_select,
                              us_para=['Mu','Ms'],
                              cell_type_para='Clusters',
                              embed_para='X_umap',
                              save_path='cell_type_u_s_cele.csv')
[7]:
cell_type_u_s=pd.read_csv('./cell_type_u_s_cele.csv')
[ ]:
loss_df, cellDancer_df=cd.velocity(cell_type_u_s,
                                   permutation_ratio=0.125,
                                   norm_cell_distribution=False,
                                   n_jobs=1)
[82]:
cellDancer_df=cd.compute_cell_velocity(cellDancer_df=cellDancer_df, projection_neighbor_choice='gene', expression_scale='power10', projection_neighbor_size=10, speed_up=(100,100))
[70]:
from celldancer.utilities import export_velocity_to_dynamo
adata = export_velocity_to_dynamo(cellDancer_df, adata_select)
[71]:
scv.tl.velocity_graph(adata)
computing velocities
    finished (0:00:00) --> added
    'velocity', velocity vectors for each individual cell (adata.layers)
computing velocity graph (using 1/64 cores)
WARNING: Unable to create progress bar. Consider installing `tqdm` as `pip install tqdm` and `ipywidgets` as `pip install ipywidgets`,
or disable the progress bar using `show_progress_bar=False`.
    finished (0:00:00) --> added
    'velocity_graph', sparse matrix with cosine correlations (adata.uns)
[88]:
scv.tl.recover_dynamics(adata)
recovering dynamics (using 1/64 cores)
    finished (0:00:18) --> added
    'fit_pars', fitted parameters for splicing dynamics (adata.var)
[89]:
scv.tl.latent_time(adata)
computing terminal states
    identified 0 region of root cells and 1 region of end points .
    finished (0:00:00) --> added
    'root_cells', root cells of Markov diffusion process (adata.obs)
    'end_points', end points of Markov diffusion process (adata.obs)
WARNING: No root cells detected. Consider specifying root cells to improve latent time prediction.
computing latent time using root_cells as prior
    finished (0:00:00) --> added
    'latent_time', shared time (adata.obs)
[94]:
import phylovelo as pv
from mpl_toolkits.axes_grid1.inset_locator import inset_axes
[95]:
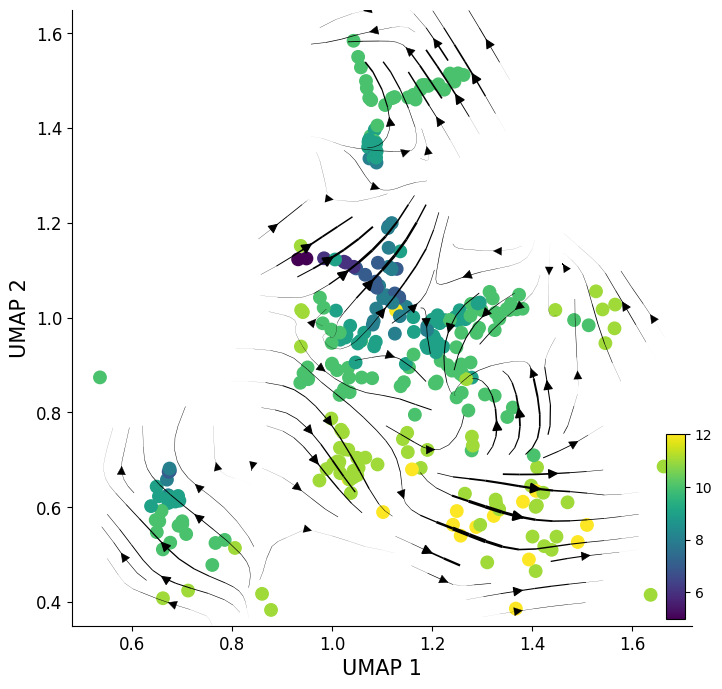
fig, ax = plt.subplots()
scatter = ax.scatter(adata.obsm['X_umap'][:, 0], adata.obsm['X_umap'][:, 1], c=adata.obs['generation_time'], s=80)
ax = pv.ana_utils.velocity_plot(adata.obsm['X_umap'], adata.obsm['velocity_umap'], ax, 'stream',streamdensity=1.2, grid_density=25, radius=0.12, lw_coef=1500, arrowsize=1.5)
ax.figure.set_size_inches(8,8)
ax.set_xlabel('UMAP 1', fontsize=15)
ax.set_ylabel('UMAP 2', fontsize=15)
plt.yticks(fontsize=12)
plt.xticks(fontsize=12)
cbaxes = inset_axes(ax, width="3%", height="30%", loc='lower right')
plt.colorbar(scatter, cax=cbaxes, orientation='vertical')
ax.spines['right'].set_visible(False)
ax.spines['top'].set_visible(False)
ax.set_ylim(0.35,1.65)
[95]:
(0.35, 1.65)
[96]:
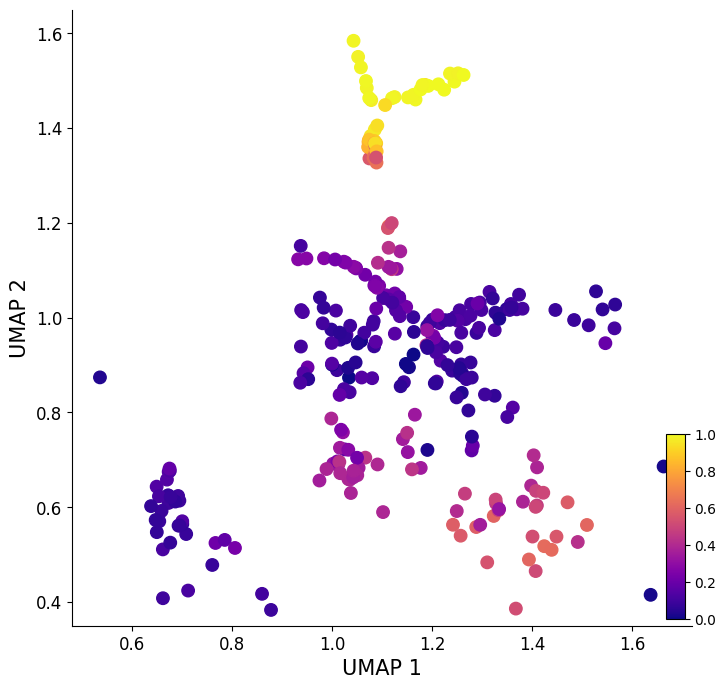
fig, ax = plt.subplots()
scatter = ax.scatter(adata.obsm['X_umap'][:, 0], adata.obsm['X_umap'][:, 1], c=adata.obs['latent_time'], cmap='plasma', s=80)
ax.figure.set_size_inches(8,8)
ax.set_xlabel('UMAP 1', fontsize=15)
ax.set_ylabel('UMAP 2', fontsize=15)
plt.yticks(fontsize=12)
plt.xticks(fontsize=12)
cbaxes = inset_axes(ax, width="3%", height="30%", loc='lower right')
plt.colorbar(scatter, cax=cbaxes, orientation='vertical')
ax.spines['right'].set_visible(False)
ax.spines['top'].set_visible(False)
ax.set_ylim(0.35,1.65)
[96]:
(0.35, 1.65)
[98]:
from scipy.stats import spearmanr
x = adata.obs['embryo_time']
y = adata.obs['latent_time']

a, b = np.polyfit(x, y, deg=1)
y_est = a * np.linspace(0,700,100) + b

fig, ax = plt.subplots(figsize=(8, 8))
ax.scatter(x, y, alpha=0.4, s=70)
ax.plot(np.linspace(0,700,100), y_est, '-', c='k')
ax.set_xlabel('Embryo time', fontsize=17)
ax.set_ylabel('CellDancer pseudotime', fontsize=17)
rho, pval = spearmanr(x, y)
ax.text(0, 1, r"Spearman's $\rho$={:.2g}".format(rho), fontsize=17)
ax.text(0, 0.9, r'$p={}\times 10^{}$'.format(*r'{:.2e}'.format(pval).split('e')).replace('^', '^{').replace('$', '}$')[1:], fontsize=17)
# ax.text(0, 0.9, r'$p={:.2e}$'.format(pval), fontsize=17)

ax.spines['right'].set_visible(False)
ax.spines['top'].set_visible(False)

[ ]:
[ ]:
[ ]: