Apply PhyloVelo to clonal lineage tracing data - TCR
We now extend PhyloVelo to clonal lineage tracing data based on static barcodes such as lentiviral barcoding (e.g. LARRY and CellTagging) and T/B cell receptor sequences. Because the cell population size of a uniquely labelled clone at observation indicates its relative proliferation activity in the past division history, we thus used clone size as the surrogate of phylogenetic time in PhyloVelo.
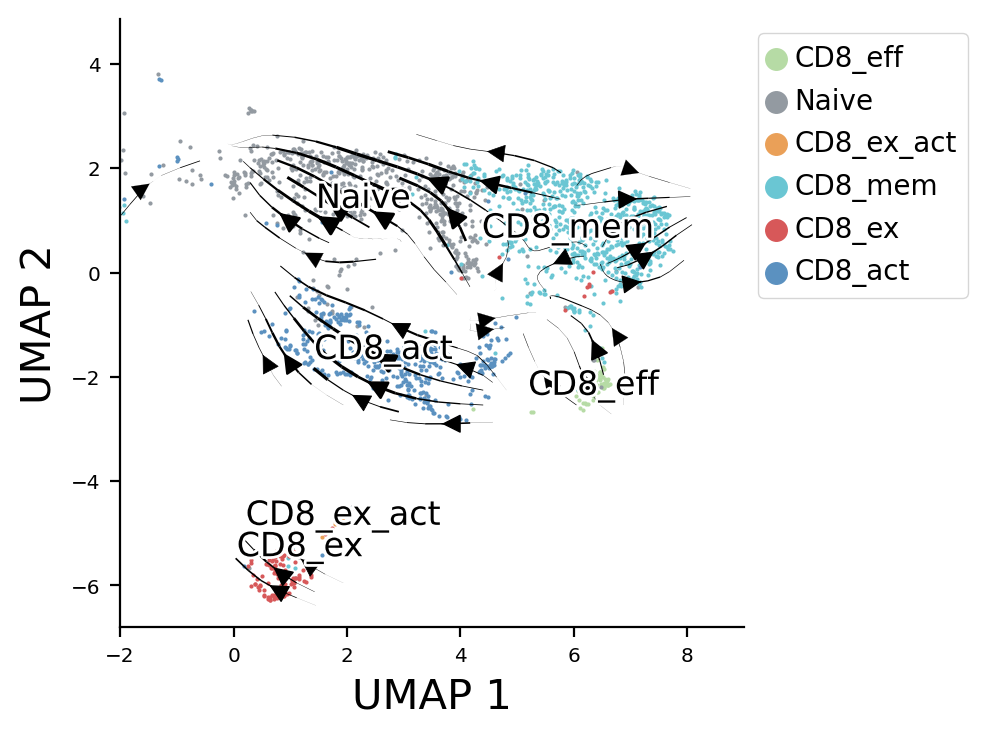
Here is an example of using PhyloVelo to infer intratumor CD8+ T cells cell-fate.
The single-cell TCR and RNA sequencing data of T cells can be accessed through GSE123813.
[1]:
import matplotlib.pyplot as plt
import pandas as pd
import numpy as np
import phylovelo as pv
/home/wangkun/miniconda3/lib/python3.9/site-packages/phylovelo/sim_utils.py:5: TqdmExperimentalWarning: Using `tqdm.autonotebook.tqdm` in notebook mode. Use `tqdm.tqdm` instead to force console mode (e.g. in jupyter console)
  from tqdm.autonotebook import tqdm
[2]:
plt.rcParams['font.size'] = 12
import count matrix and metadata
[3]:
count = pd.read_csv('../../../demo/datasets/tcr/tcr_count_demo.csv', index_col=0)
metadata = pd.read_csv('../../../demo/datasets/tcr/tcr_metadata_demo.csv', index_col=0)
The ‘su009’ sample is selected to inference the velocity to avoid batch effect
[7]:
sel_cells = metadata[(metadata.patient=='su009').to_numpy()].index
[8]:
sd = pv.scData(count=count.loc[sel_cells], Xdr=metadata.loc[sel_cells][['UMAP1', 'UMAP2']])
[9]:
sd.drop_duplicate_genes()
sd.normalize_filter()
sd.cell_states = metadata.loc[sel_cells]['cluster'].to_numpy()
[10]:
clonesize = metadata.loc[sel_cells].clonesizeInCase.to_numpy()
[11]:
pv.velocity_inference(sd, np.round(np.log(clonesize)), cutoff=0.97, target='x_normed')
/home/wangkun/miniconda3/lib/python3.9/site-packages/scipy/optimize/_numdiff.py:576: RuntimeWarning: invalid value encountered in subtract
  df = fun(x) - f0
[11]:
<phylovelo.data_struct.scData at 0x7f79508f9b50>
Create full sample dataset and transfer the velocity from ‘su009’ sample.
[32]:
sd_full = pv.scData(count=count, Xdr=metadata[['UMAP1', 'UMAP2']])
[33]:
sd_full.drop_duplicate_genes()
sd_full.normalize_filter()
sd_full.cell_states = metadata['cluster'].to_numpy()
[34]:
sd_full.x_normed = sd_full.x_normed[sd.x_normed.columns]
sd_full.velocity = sd.velocity
[35]:
pv.velocity_embedding(sd_full, target='x_normed',n_neigh=300)
[35]:
<phylovelo.data_struct.scData at 0x7f7947188fa0>
[37]:
color_map = {'CD8_act':'#5b91c0',
             'CD8_eff':'#b6dba5',
             'CD8_ex':'#d75859',
             'CD8_ex_act':'#eaa058',
             'CD8_mem':'#6ac6d3',
             'Naive':'#939aa1'}
[38]:
fig, ax = plt.subplots()
for i in set(sd_full.cell_states):
    ax.scatter(sd_full.Xdr.iloc[np.array(sd_full.cell_states)==i, 0], sd_full.Xdr.iloc[np.array(sd_full.cell_states)==i, 1], s=1, label=i, c=color_map[i])

ax = pv.velocity_plot(sd_full.Xdr.to_numpy(), sd_full.velocity_embeded, ax, 'stream',streamdensity=1.4, grid_density=40, radius=0.4, lw_coef=8000, arrowsize=1.5)
ax.figure.set_size_inches(4, 4)

ax.set_xlabel('UMAP 1', fontsize=15)
ax.set_ylabel('UMAP 2', fontsize=15)
lgnd = ax.legend(bbox_to_anchor=(1,1), fontsize=10, loc='upper left')
ax.spines['right'].set_visible(False)
ax.spines['top'].set_visible(False)
for i in lgnd.legendHandles:
    i._sizes = [60]
ax.set_xlim(-2,9)
pv.label_name(sd_full.Xdr.to_numpy(), sd_full.cell_states, ax)
/tmp/ipykernel_125295/1133422121.py:13: MatplotlibDeprecationWarning: The legendHandles attribute was deprecated in Matplotlib 3.7 and will be removed two minor releases later. Use legend_handles instead.
  for i in lgnd.legendHandles:
[38]:
<Axes: xlabel='UMAP 1', ylabel='UMAP 2'>
[ ]:
[ ]: